A fully-complemented sandbox: bringing customer insights and competitive knowledge together in one space for collaboration
A few months ago, a couple of colleagues and I were tasked with finding a tool that can be used to collect and share customer feedback about a complex but promising service experience offered by our company in the building industry. Many customer service groups and sales people in the organization consistently receive much internal and external feedback on products and services — and marketers, developers and design strategists like me need it to design quality customer experiences. But it can be burdensome for a service design team to retrieve all the salient bits of these observations, criticisms and success metrics from different sources when needed, as they are often buried in long-lost email chains or in the memories of the receiver. At the same time, we were challenged to find a tool for collecting competitive intelligence, which should also come into play in service design projects.
After some online digging and comparative spreadsheeting, we found that there are a number of easy-to-use tools out there for collecting customer research and competitive intelligence. Additionally, we also found online tools for collaboratively white-boarding ideas — for Design Thinking proponents, the stage that follows research — that can greatly enhance, among other design activities, the blueprinting of a customer’s experience of service. But how do we go about harnessing the insights collected in customer research and competitive intelligence tools to innovate solutions using an online whiteboard space? In this article, will show how stakeholders, even when working remotely, can bring high-quality customer and competitive research to the design process using an online constellation of offerings from three startups that have come to the rescue.
There are a few criteria that should be present in the system:
- It should solve the challenge of storing, organizing, dissecting and sharing numerous sources of customer and internal feedback
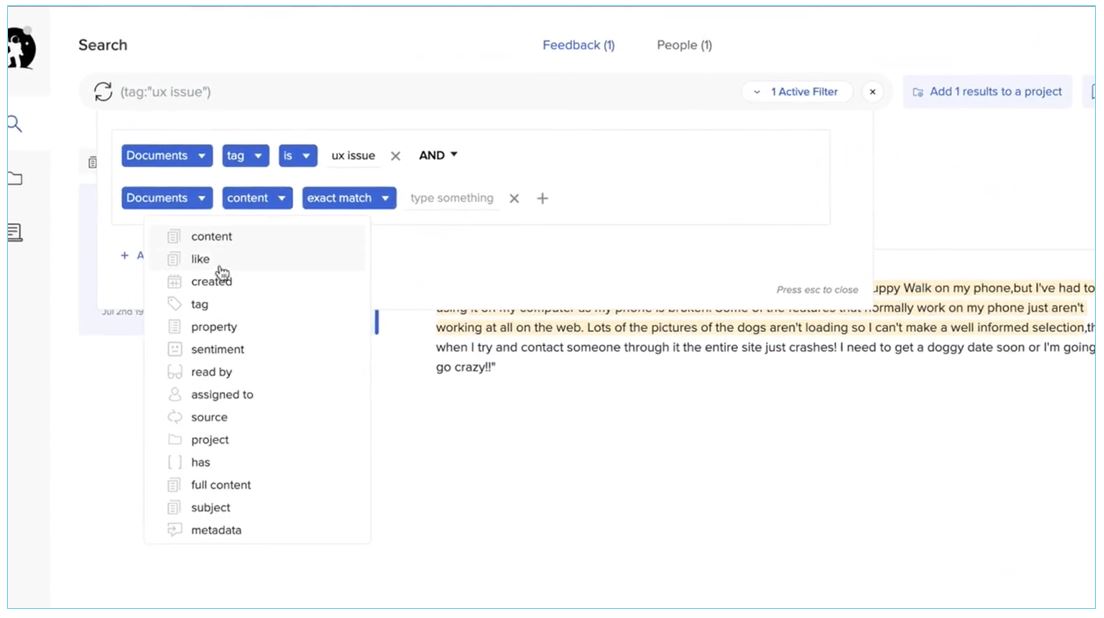
- Customer and competitive data should be easily searched and tagged
- The system should be ideal for collecting both quantitative and qualitative customer feedback and stories
- It should be a collaborative space where the research can be easily identified and understood by a multi-disciplinary group to design solutions making use of all the salient data
The ultimate goal is to create customer value, and even breakthrough customer experiences, but also to enhance innovation practices for the internal team. The system should become a part of our innovation practice, something that can be returned to again and again for new insights and validation. For an organization, these kinds of innovation capabilities can build on other customer-centric practices to bring about a user experiences so good that the firm can boast of what is sometimes described as a competitive moat around its offerings that is difficult for competitors to scale. In other words, great customer experiences that are difficult to copy because they have come to fruition so successfully.
Qualitative and quantitative: you must have both
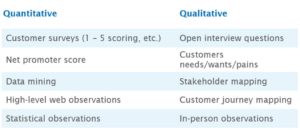
The research that is to be introduced into this system should be rich and from numerous sources — customers, internal stakeholders and competitors. On the customer side, quantitative research is sought for insights on the success of a product or experience: customer surveys with numerical scoring, net promoter scores, data mining, high-level web observations and other statistical observations related to a user’s time spent on a digital interface are all used to inform service design decisions.
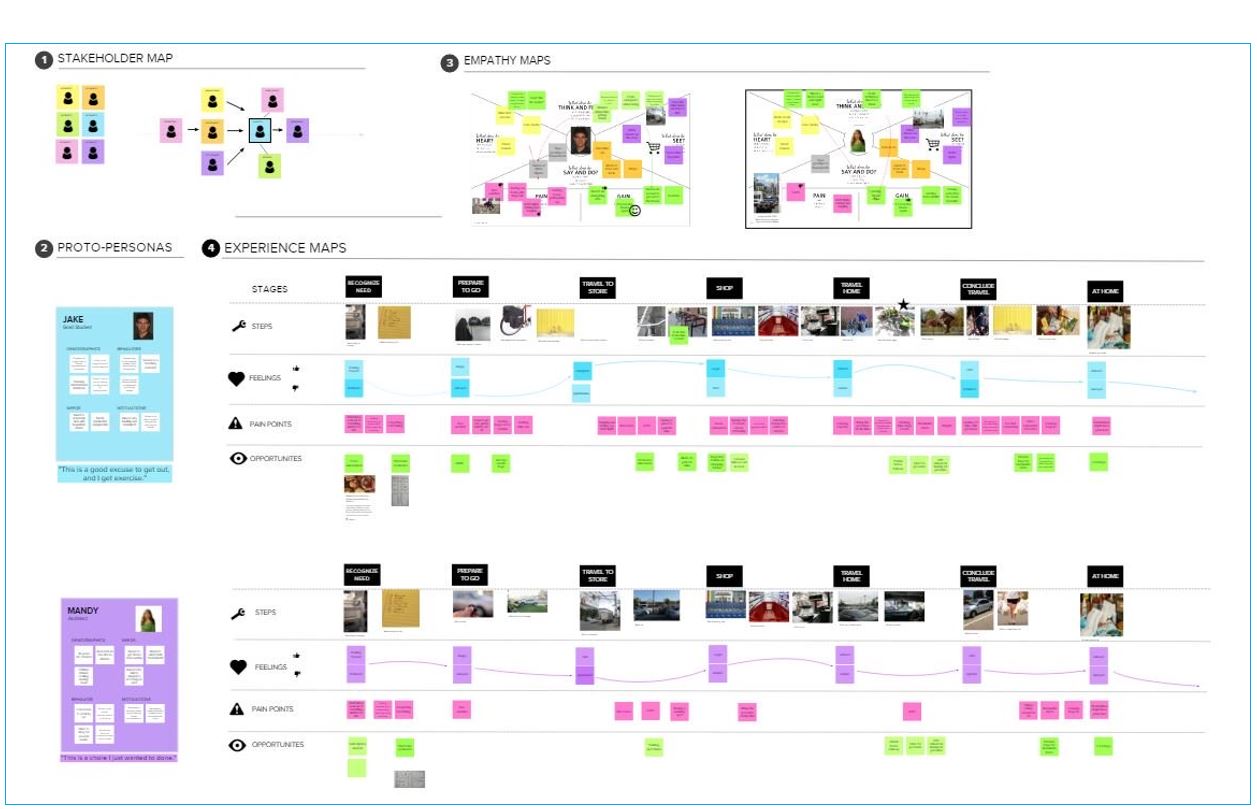
Qualitative research is important to discovering what is important to users at the front-end of the design project, but also for keeping the customer top-of mind throughout the design and development process. Deep-dive customer interviews, capturing customer jobs, pains and gains, mapping as-is or to-be customer journeys, stakeholder mapping, and ethnographic research are all examples of qualitative research. Qualitative offers richer insights than quantitative for understanding customers in-depth so we can make better service design decisions. Real interviews, for example, allow for follow-up questions to aid in iterative solution-making. And qualitative research is now easier to capture, with online tools that allow for richer experiences that don’t require people to leave the office to travel to a customer if timelines are tight. Automated tools allow for reporting that makes it easier to tally and share key quotes and videos. All this means that a rich qualitative research project can be set up quickly and wrapped up in a few days.
Fuel for Design Thinking
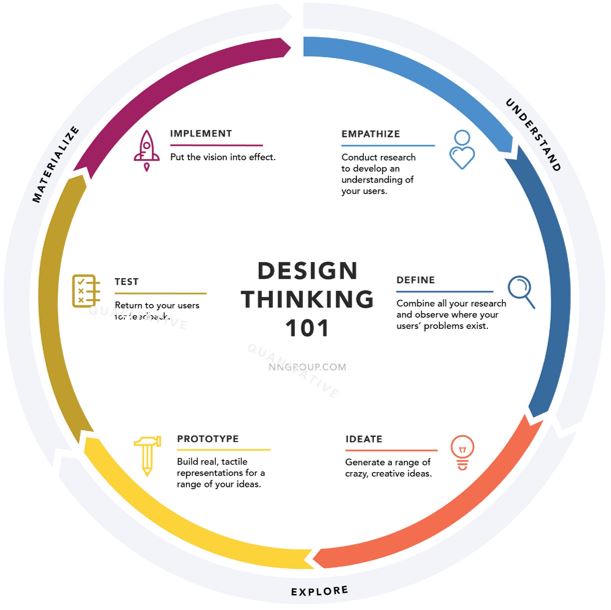
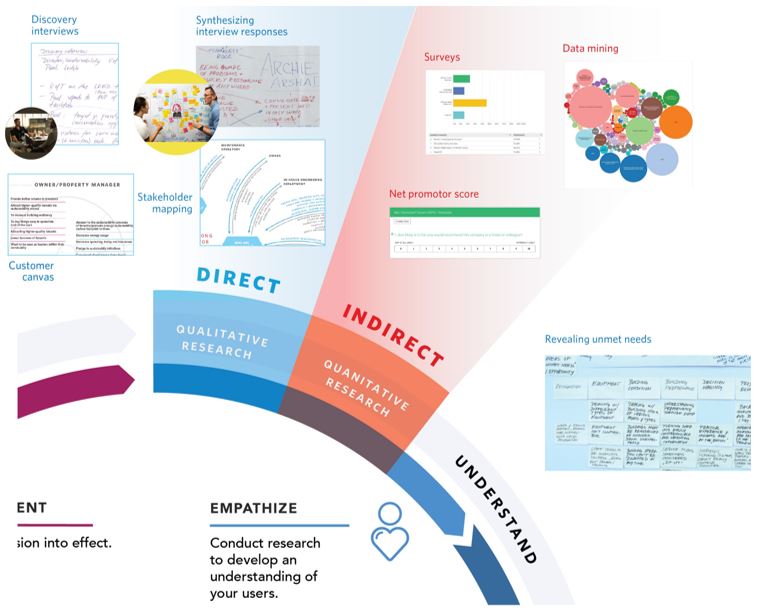
Collecting research is central to the Design Thinking processes as practiced in many organizations that want to try something different to achieve a competitive edge. Figure 1 is a depiction of the Design Thinking process from the Nielsen Norman Group, covering the customer empathy component at the front-end of an innovation project, followed by the identification of unmet needs, idea generation, prototyping and the testing/implementing phases. In figure 2, I have magnified the Understand phase to visualize different types of qualitative and quantitative research that should come together to provide a solid grounding for the front-end of the design process. Here, qualitative research is shown as coming directly from the customer while quantitative research indirectly relays customer behavior and survey entries. In actual practice, some forms of quantitative data will actually be gathered farther along the design journey in the testing/implementation phase, which will serve to inform a new understanding of the user’s experience with the service, which will in turn kick off the development of a new version of the service.
Insights resulting from discussing unmet needs are pictured as an activity that occurs after the Understand component of Design Thinking. Almost any of the research activities discussed, however, can be engaged at any stage of Design Thinking for validation, feedback and gut-checks. Customer journey mapping, for example, is useful for seeing all the component parts of the service during the design project to validate if the customer experience is really coming together as a coherent system of friction-removing activities at different service touch points.
Covering the bases with the three Cs
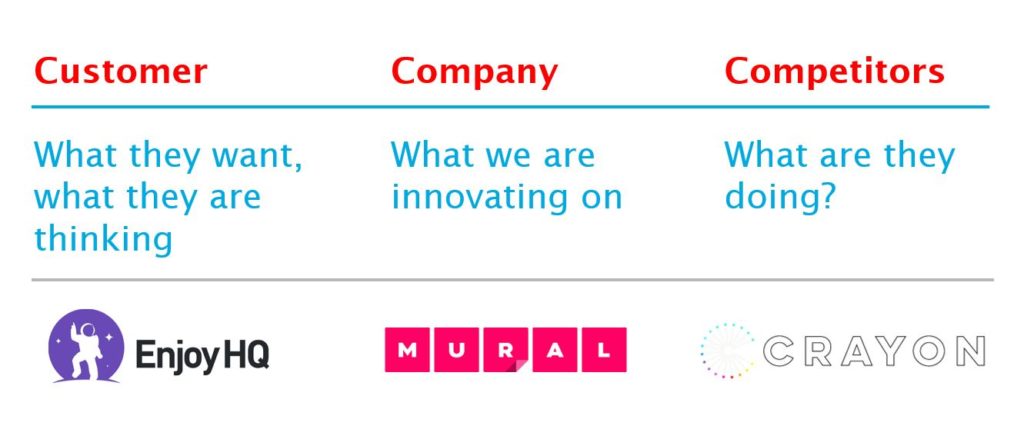
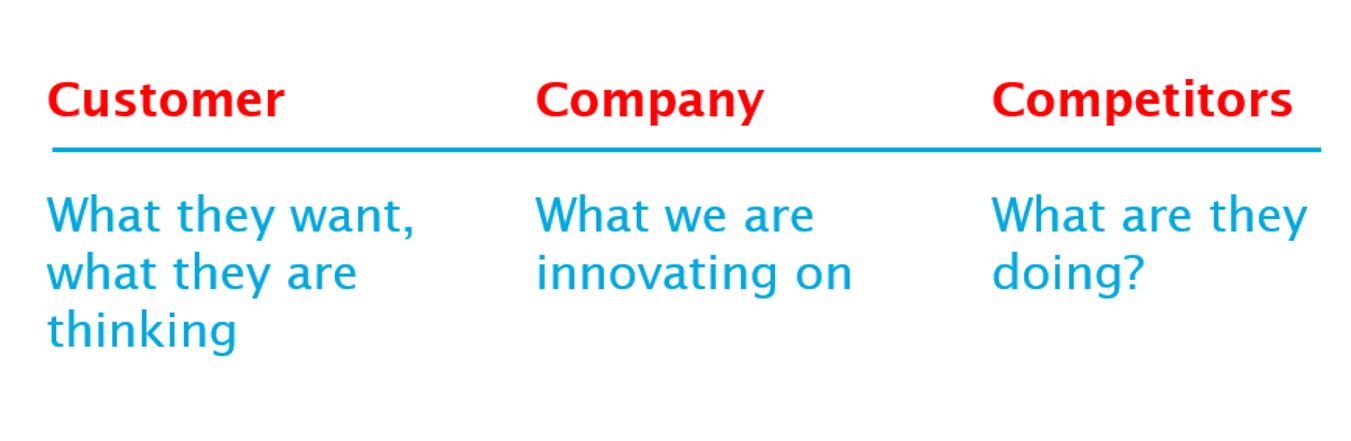
Customer and competitive research account for two of the three areas that inform the creation of products and services. My time working in a customer experience group has taught me the importance of balancing the considerations of what the customer feels and wants, what the company does to allow for innovation to happen, and understanding what the competition is doing at any one time. Customer, Company and Competition can be thought of as the Three Cs that should be given their due diligence in working through a design project. To the competition bucket, one might add other inspiration from the external environment, such as innovations from outside the competition to keep the group’s mind open to developments far-afield.
Where it all comes together
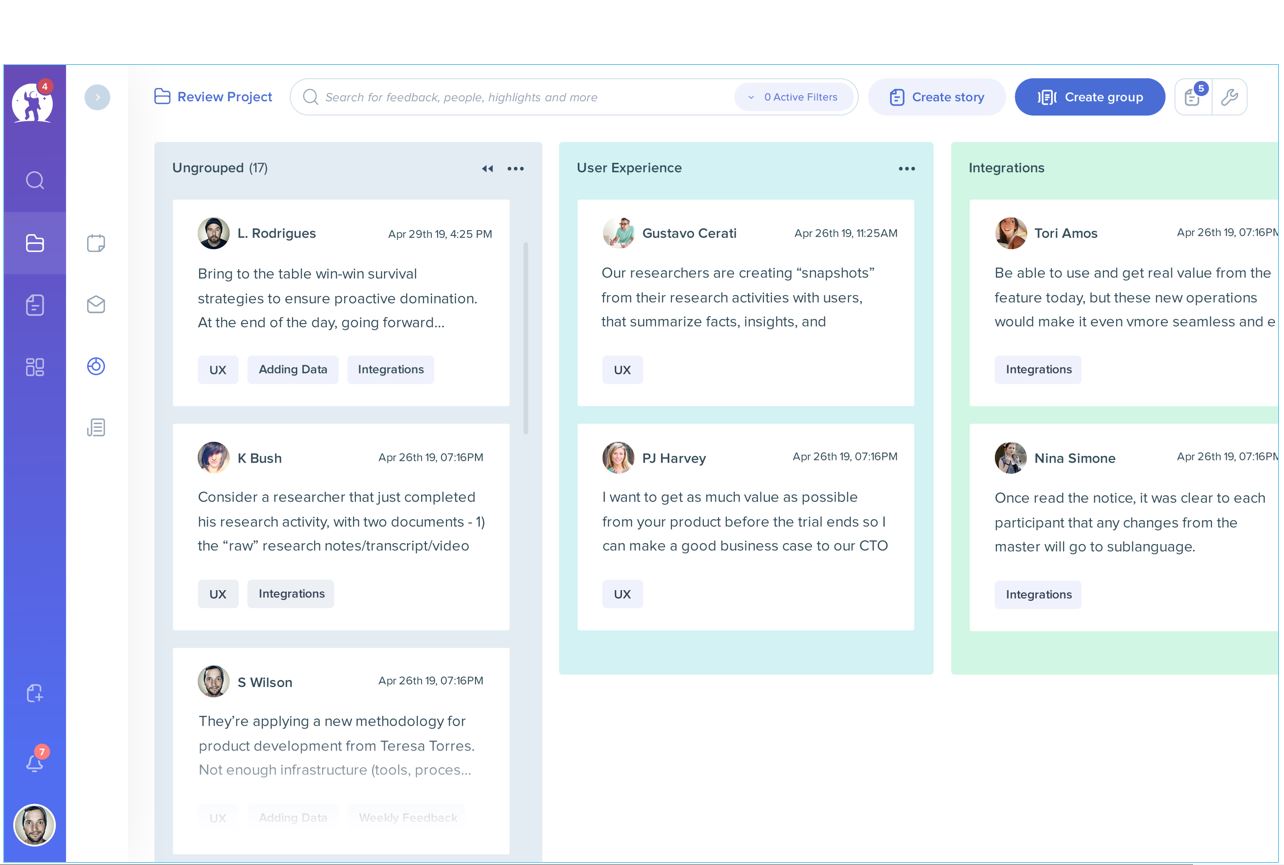
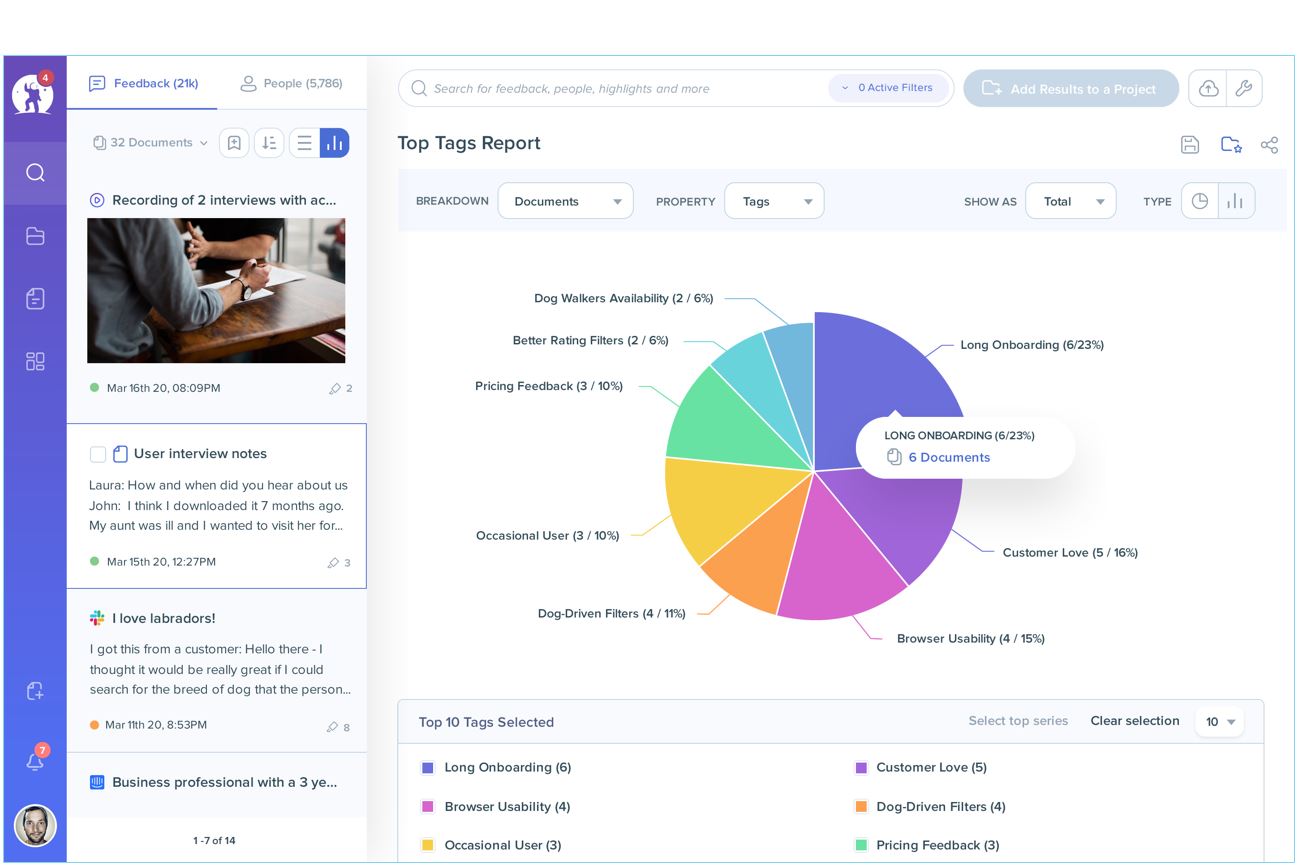
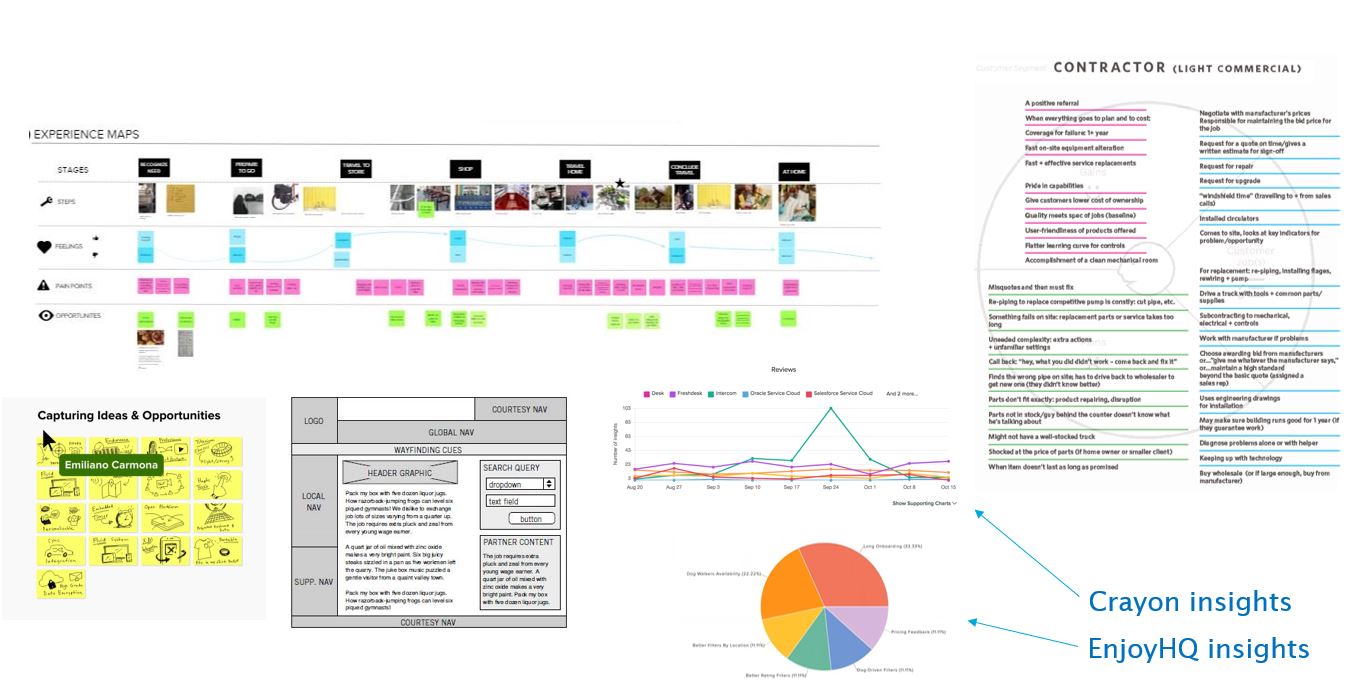
And now back to the system to be built for the collection of research and its role in customer value creation by a remote working team. For compiling customer research, we discovered EnjoyHQ, an online tool where all the customer and internal feedback on products and services can be uploaded and shared with stakeholders company-wide. For collecting competitive research, we discovered Crayon, which actively spiders its way across the internet for everything competitive as it relates to my organization, and likewise allows for sharing. Both EnjoyHQ and Crayon make it reasonably easy to group data and information for consumption, though a working group must then take steps to comment on, analyze and gather insight from the resulting charts, word clouds, searchable entries and benchmarking that are spit out of the dashboard interfaces.
The online tools having categorized and visualized the customer and competitive research for easy consumption, the service design group is then ready to bring the information into an online space to start collaborative design. The best tool we identified for this is Mural (which was recommended to us by IBM’s Design Thinking team), created to function as a virtual whiteboarding space. Mural contains a surprising number of very useful frameworks for innovation, team building and business design that have proven their worth in the Design Thinking world. In the remote working practice that has increasingly been the norm in the past year, these three services — EnjoyHQ, Crayon and Mural — are tools that can be shared on-line and in real-time to cover the crucial areas of research and innovation that must come together for quality solution building.
Here’s a run-down of each tool’s benefits with some screenshots of features:
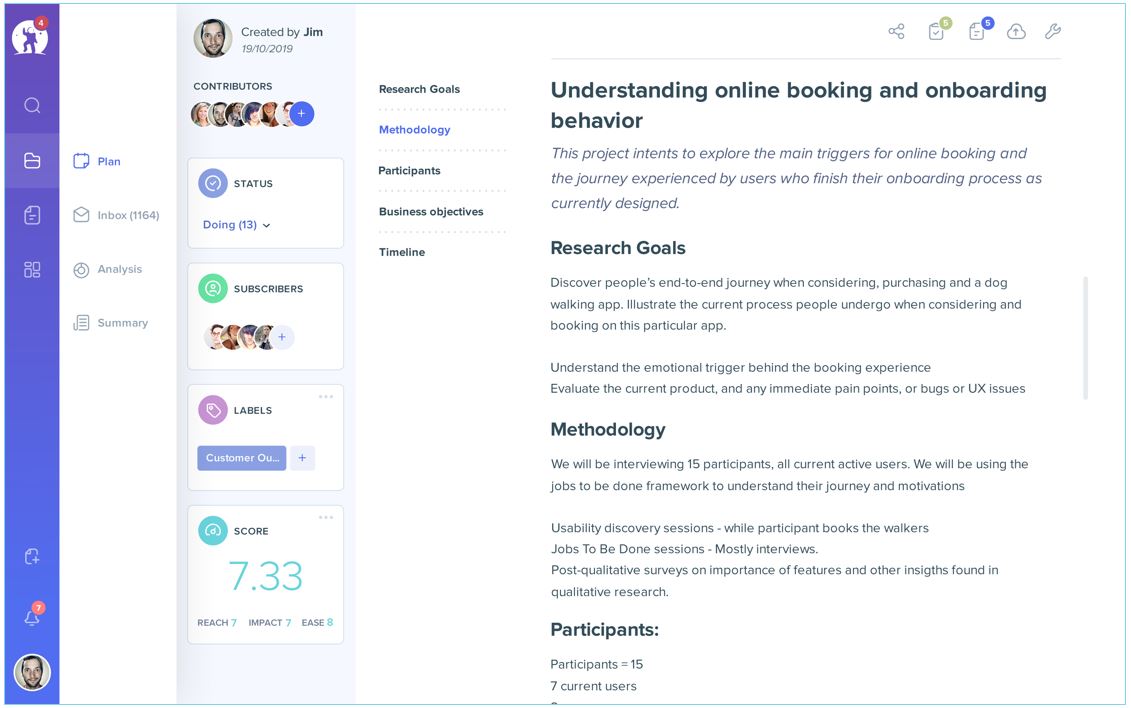
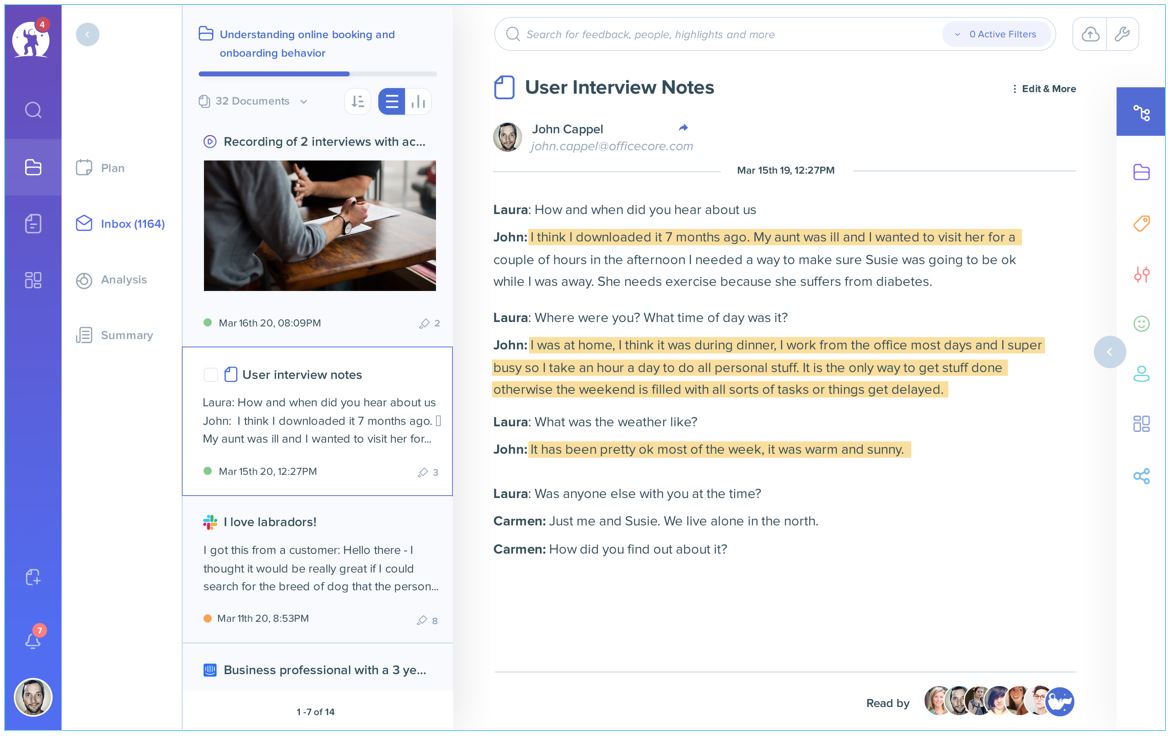
EnjoyHQ
- Organizes all our customer interviews, surveys, user testing and observations, research notes, sales and customer feedback,
and customer support tickets - Allows us to bring all of this data together to access, quantify it, and do the work of analysis
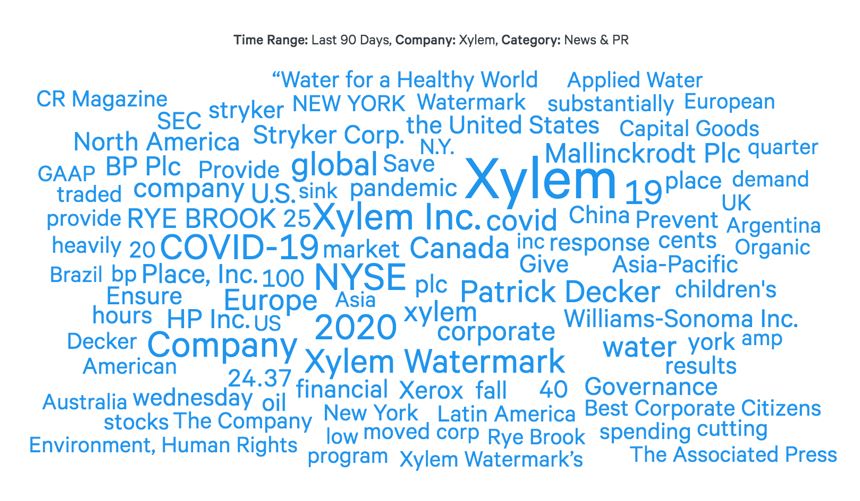
- Creates visual themes that emerge from the findings based on our classifications
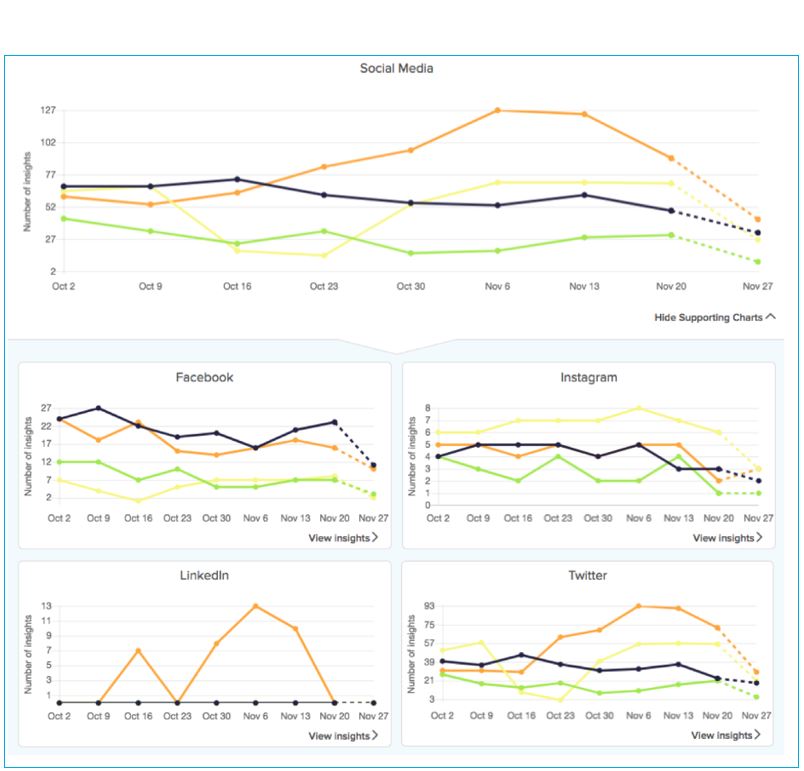
Crayon
- Tracks 100+ data types across a huge number of sources to provide a complete view of your competitors’ movements
- Helps highlight key updates and trends; spot and analyze trends and go-to market strategic shifts
- Using Crayon findings, collaborate with the team to determine what competitive actions to take
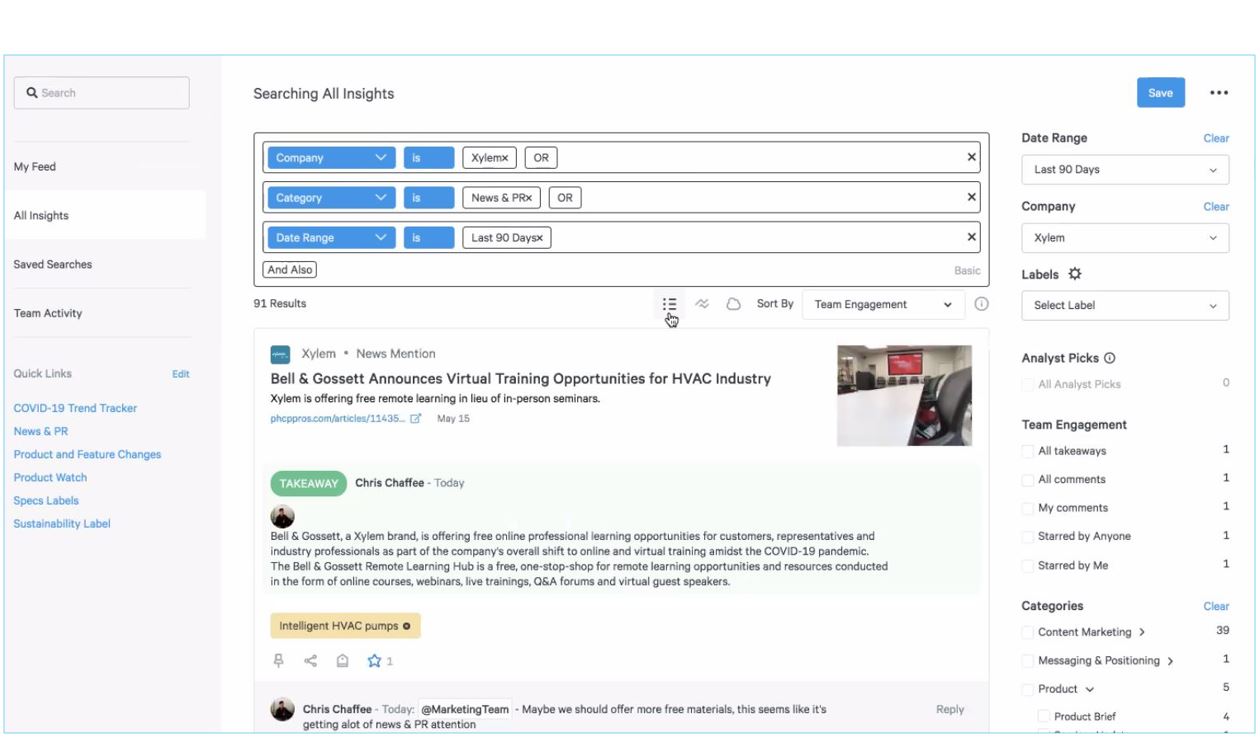
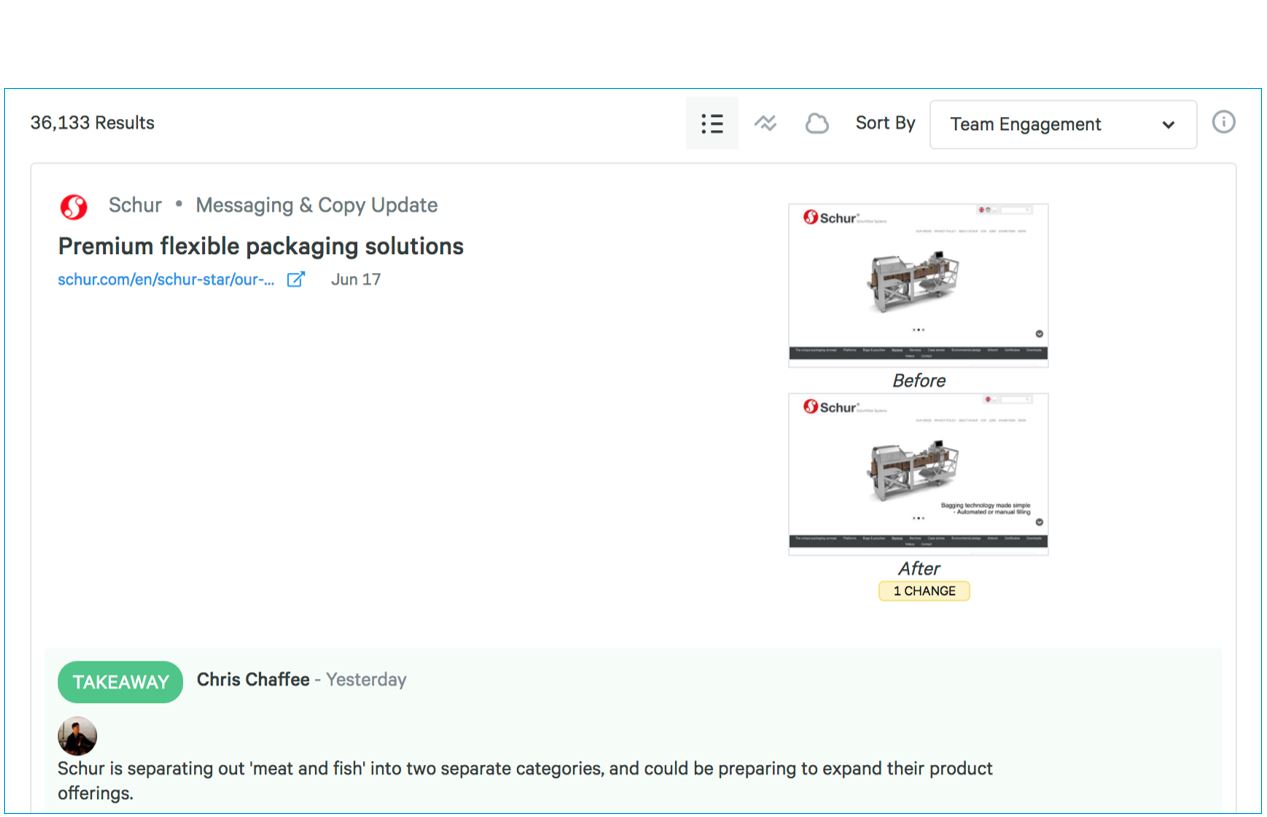
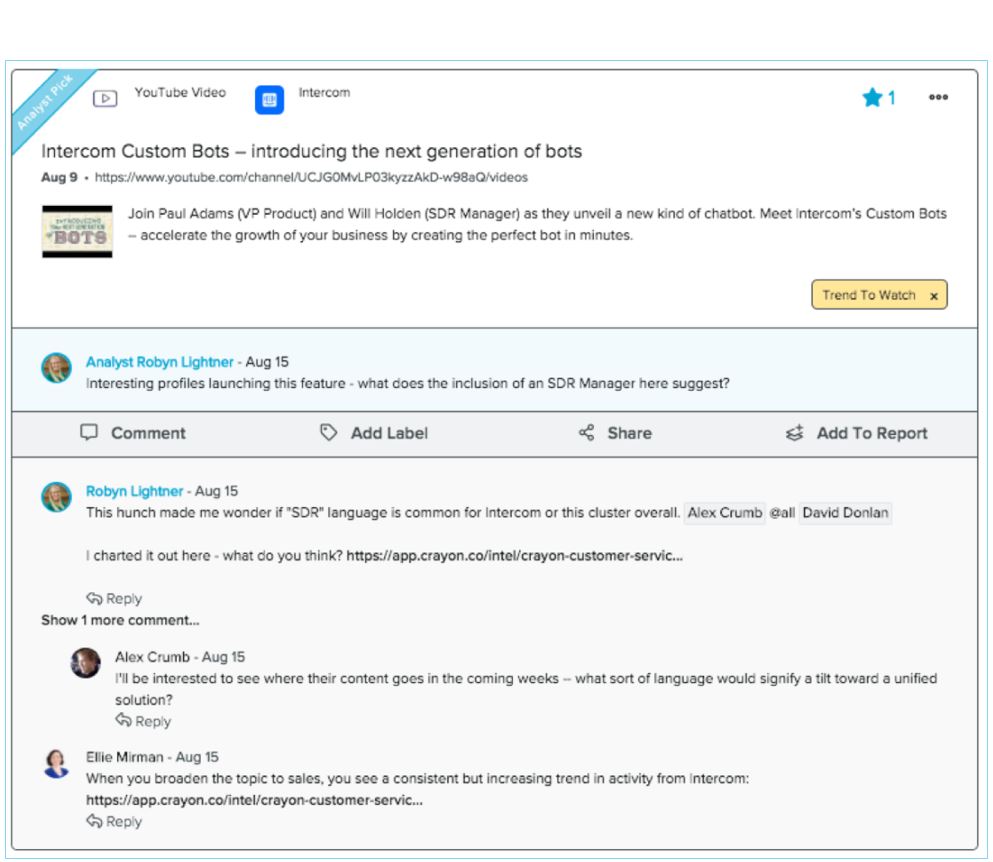
or benchmark your company’s activities in the market
It should be noted that for the money, Crayon goes the extra step in providing a certain level of human-generated summary of activity in the form of reporting that EnjoyHQ does not, though the latter service is much cheaper to subscribe to.
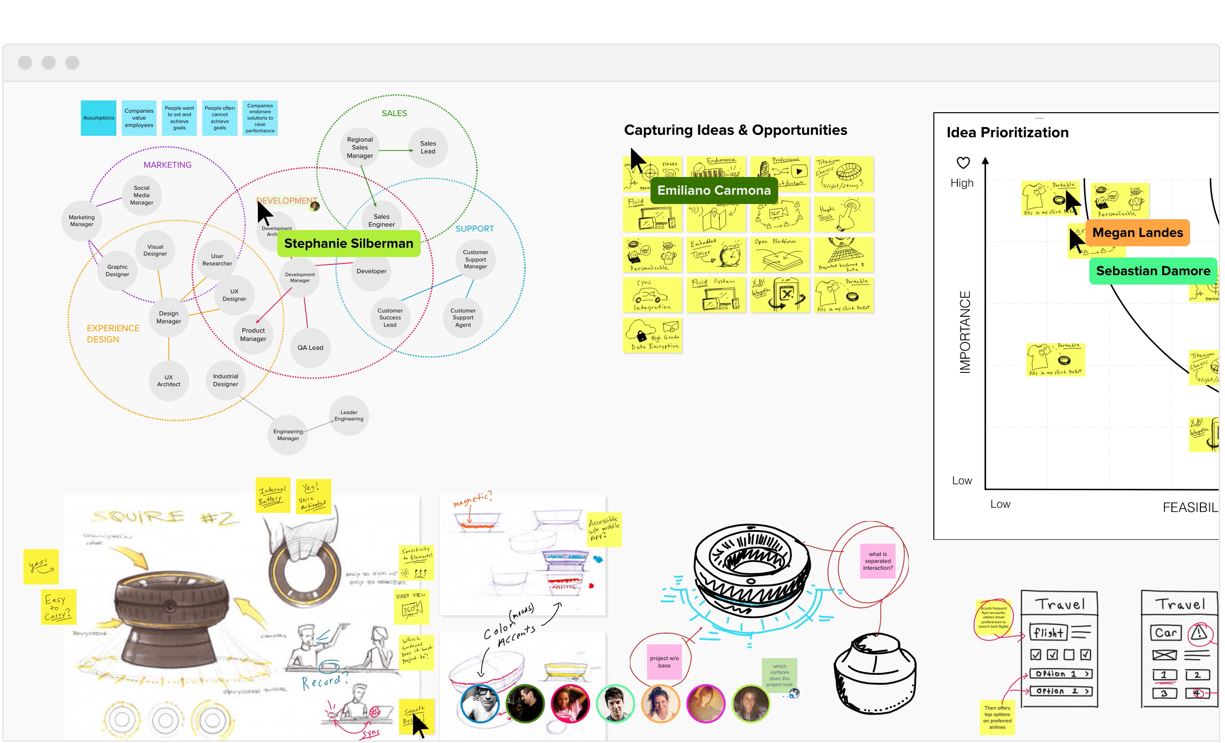
Mural
- The space in which we bring our user and competitive research to create business ideas and competitive strategies
- For collaborative solution and experience design
- Based on some of the most popular activities in design thinking and agile development methods
A review of how EnjoyHQ, Mural and Crayon fulfill the 3 Cs of designing innovative services for a company.