Case study: customer journey mapping at Armstrong
When a new CEO arrived at Armstrong and wanted to the organization take an outside-in perspective towards customers, I saw the opportunity to introduce and practice some of the strategic and design thinking frameworks I learned in OACD’s Strategic Foresight and Innovation masters program.
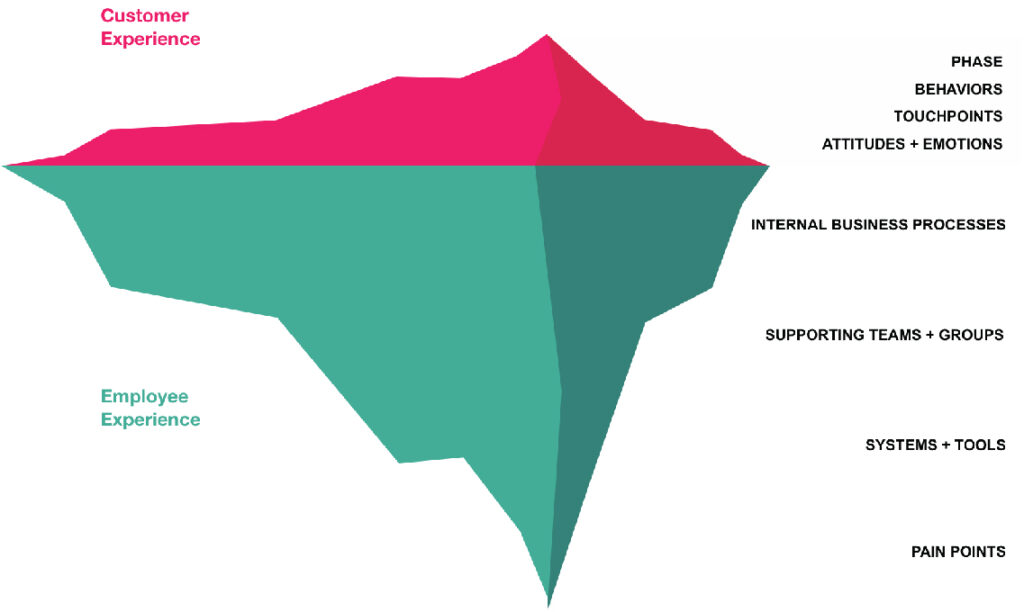
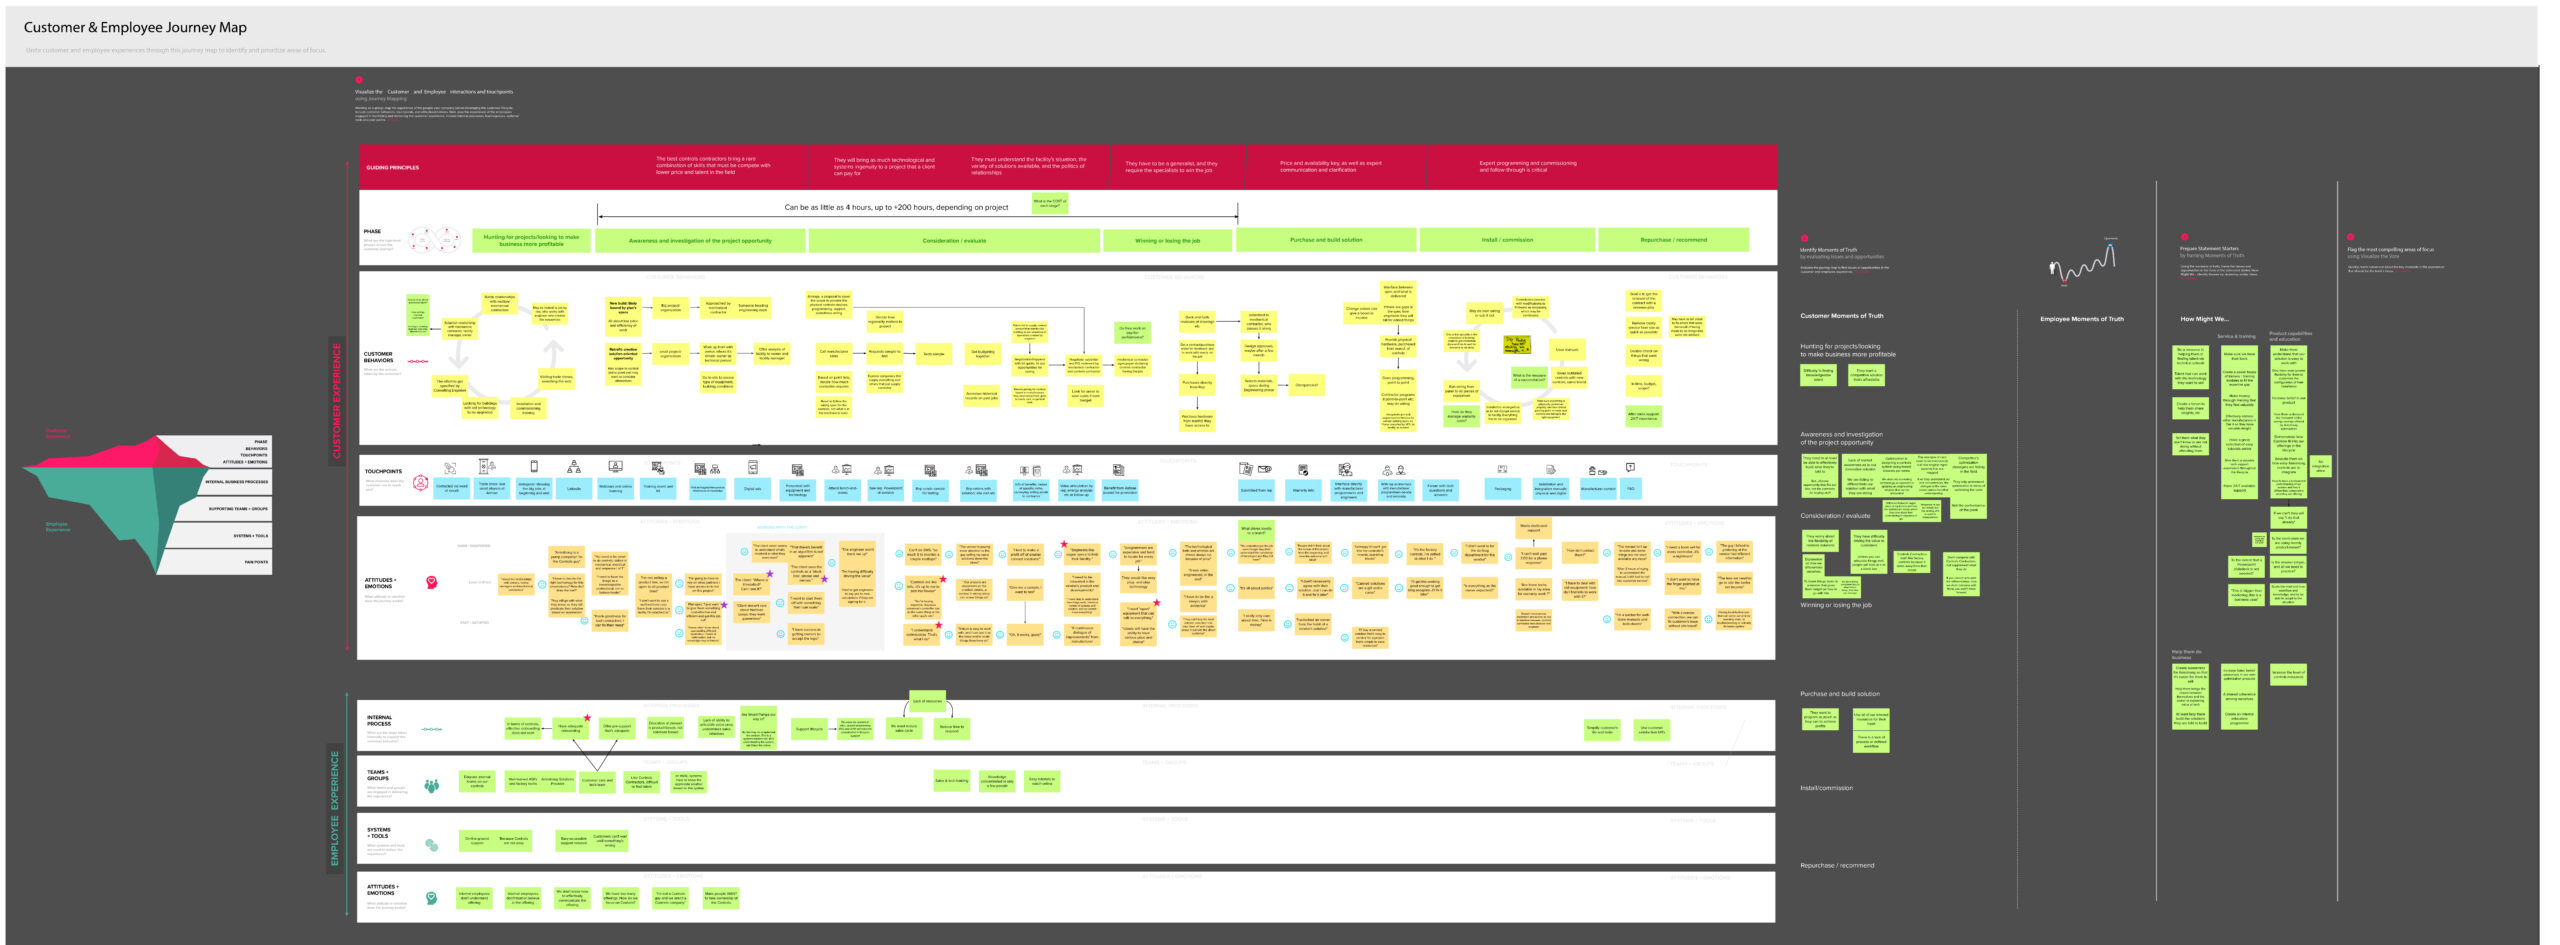
After sifting through a dozen methods I had learned for strategic planning, goal setting, capabilities mapping, business canvases and journey mapping, I was ready to make a recommendation. Together with a small group tasked with bringing an ideal approach to the CEO, we settled on customer journey mapping as the basis of a practical and meaningful project that would bring a greater outside-in perspective to Armstrong. Journey mapping is a visual alignment tool that is excellent for bringing together internal stakeholders together to understand the steps a customer takes while interacting with an organization and its products. The map can identify customer pain points, transactions that bring delight, and overall “moments of truth”, that point to opportunities for creating grater value to those we serve. Additionally, the map can be broadened to include internal teams and their support system, which bolsters everything that eventually makes its way up to the customer experience. The connection between the customer experience and the employee experience and the importance of addressing both is starkly shown in this diagram included on a Mural customer journey map template.
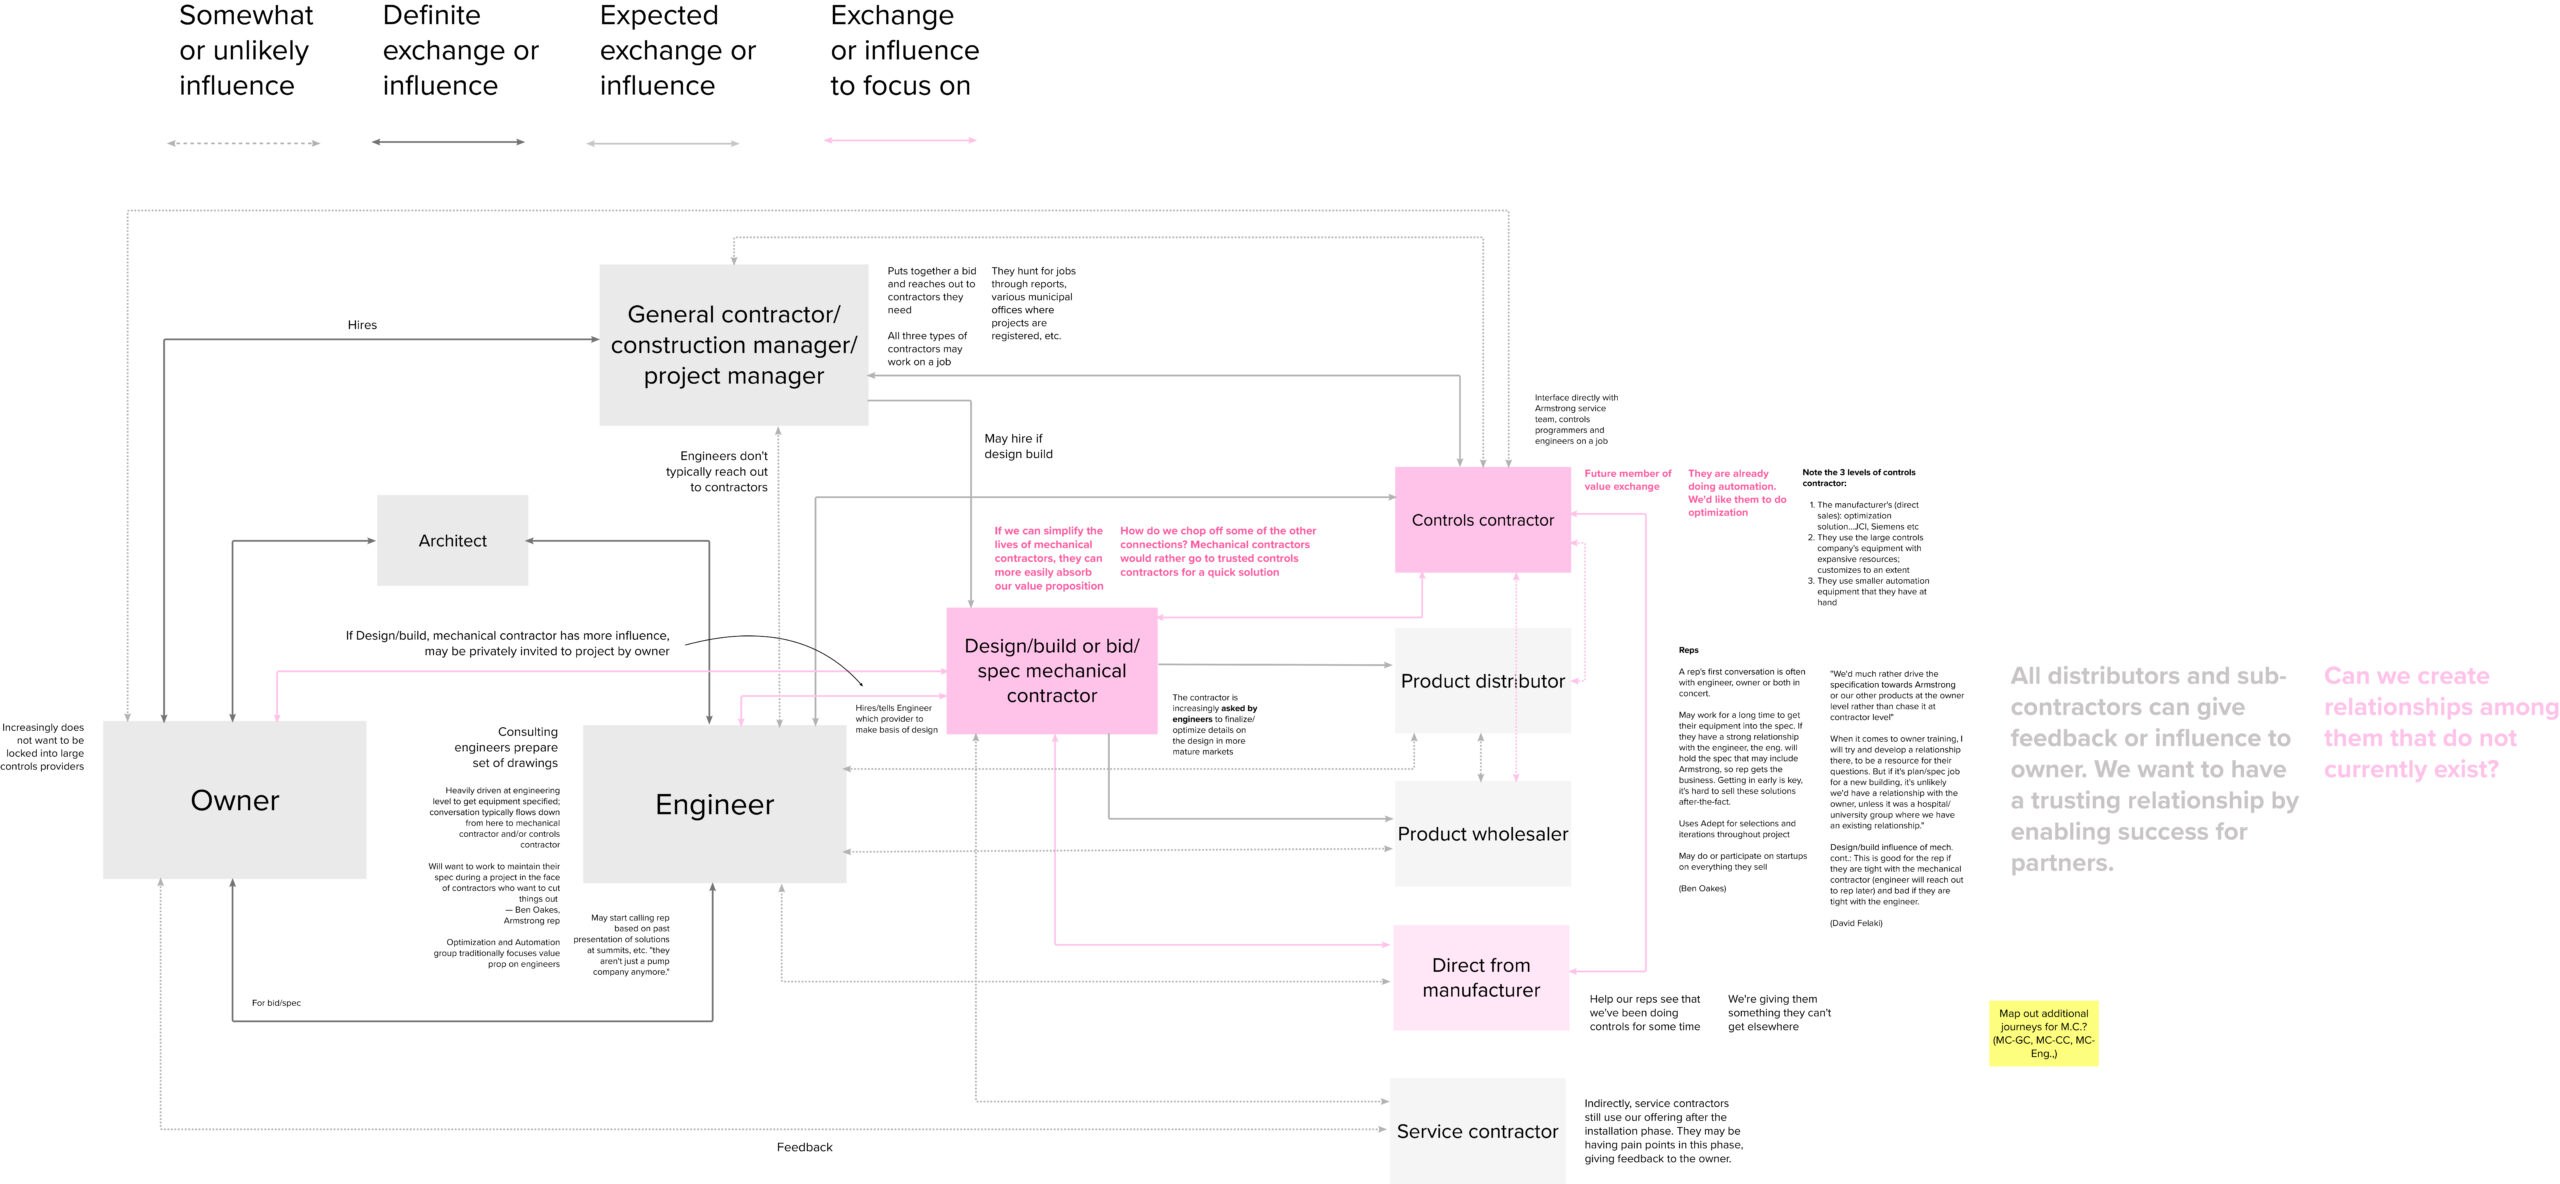
Our team consists of an executive board product director, two engineers that manage a key offering, a marketing director and manager, a sales manager and myself as design thinking facilitator. Things started off on the right track when the CEO attended the first workshop, making clear that he sponsors the project. He would continue to periodically check in on our progress over the next few weeks, emphasizing his expectation that real ‘wins’ for Armstrong should come out of journey mapping. Returning to the first day, the group set the scope for the project by agreeing on the key value exchanges we wanted to focus on, an activity I facilitated by drawing out a straw horse of a value exchange diagram showing the customers and influencers in Armstrong’s orbit. The discussions that followed helped me generate a very accurate representation of these value exchanges, with notes on relationships and roles. The key exchanges that we moved to focus on were then coloured in pick.
Ultimately, we decided to map out the experience of Controls Contractors to build up our Optimization and Automation business. This customer type is not currently influenced by Armstrong directly, as we tend to communicate more or less exclusively with a rep network. We also spent time asking ourselves important strategic questions for the Optimization and Automation business, including, “How do we capture, create and deliver value?” “How do we want Optimization and Automation to grow?” “What is the current state of the business? Are expectations being met?” “What markets and segments are served?” and “What are our gaps in our knowledge? What do we need to figure out?”
Following the discussion of these strategic questions, we determined that the map’s journey should begin at the phase where the Controls Contractor is initially looking for building projects to bid on, and should end at the end of a sale, before the installation phase (the phases are the green post-it notes at the top of the diagram below that move from left to right). We then began speaking with internal stakeholders to get a sense of what we already believe the Control Contractor’s journey looks like. Making an initial draft map allowed us to approach Controls Contractors with better-focused questions.
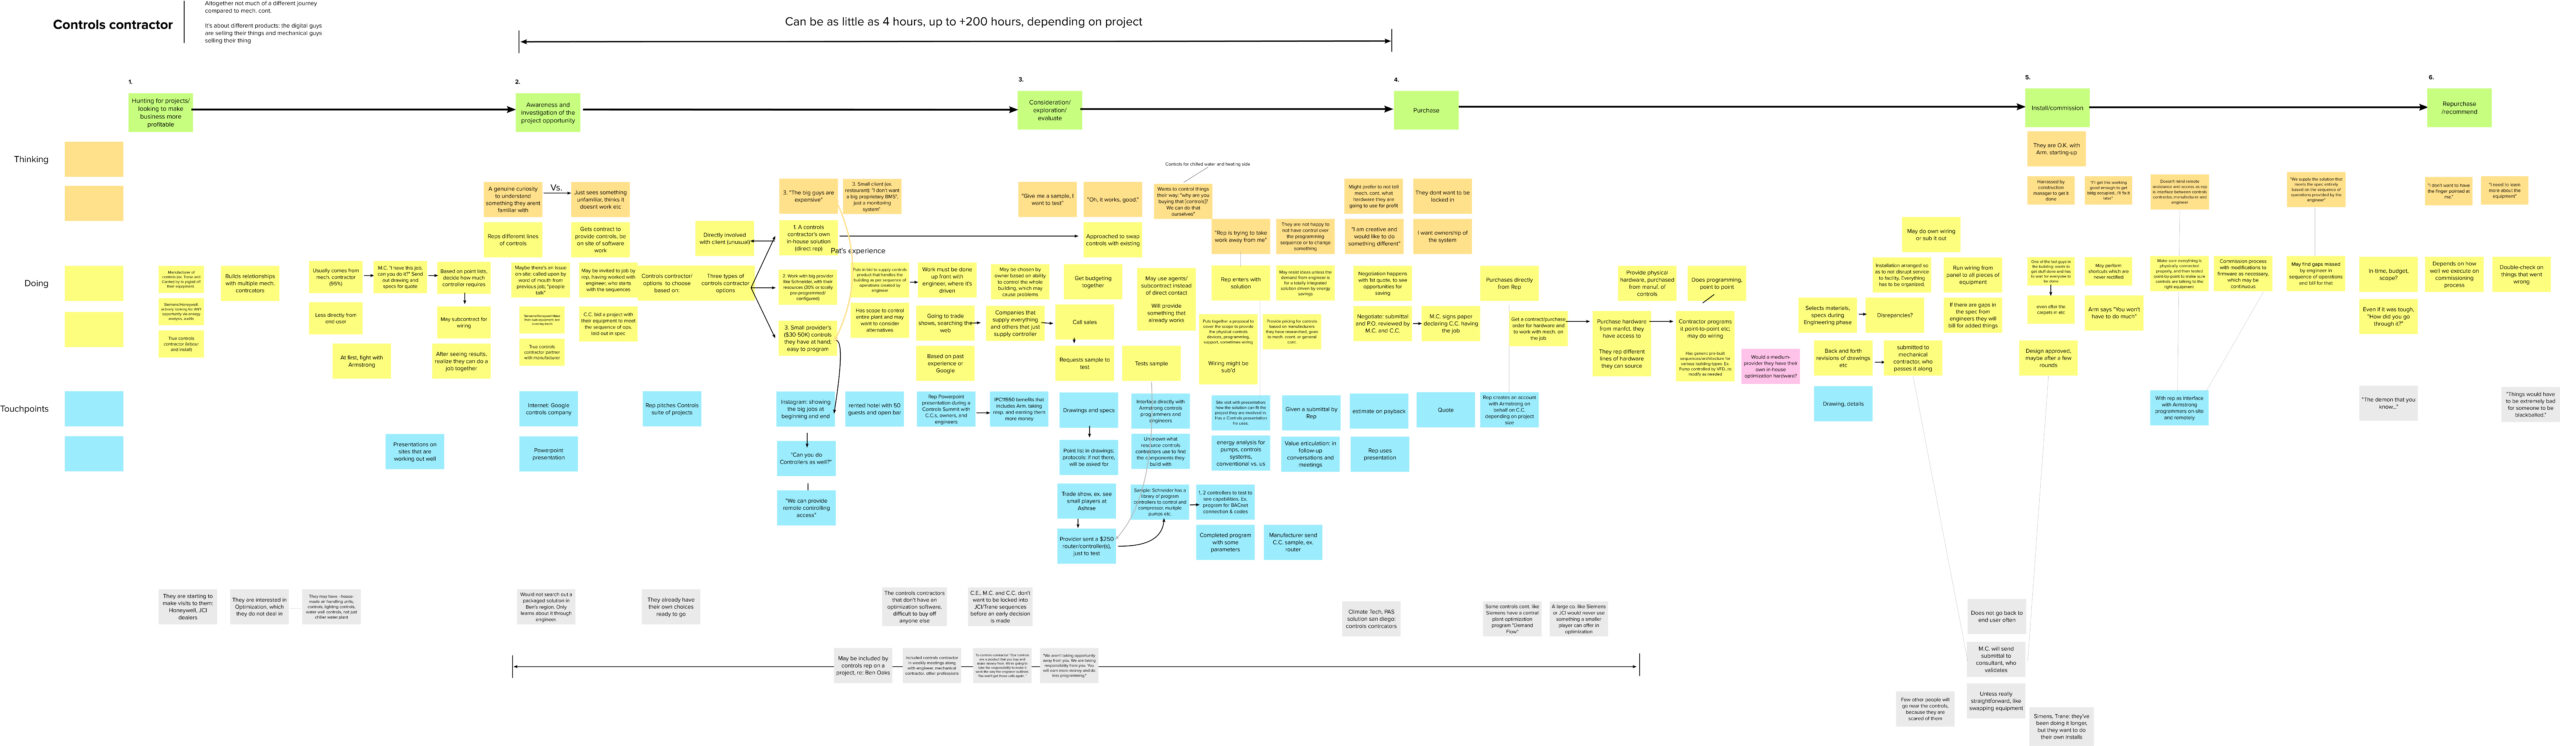
With an initial draft map created, the team spent time reviewing the various activities of the Controls Contractor along the phases, and decided on the key questions we wanted to ask them so we can come to a better understanding of key gaps in our knowledge about this segment. Research questions were generated, followed by an interview guideline containing a handful of open-ended questions designed to elicit a meaningful depth of opinions.
The task of recruiting 8-10 Controls Contractors for interviews turned out to be more difficult than anybody imagined. Controls Contractors are busy professionals are seemingly always on the go from one building site to the next, and as a group are surprisingly unknown to most people at Armstrong. After much cold calling and emails that became dead-ends, I realized that Facebook could potentially offer up participants via the various groups devoted to the building controls and management. I joined a number of these Facebook groups, offering a gift certificate to those that would allow us to interview them. Within a month I was able to recruit the full complement of Controls Contractors we needed to provide the knowledge and insights for a fully-realized journey map.
After a few weeks, we had ten interviews captured on Teams videos (some with video and others audio only). In order to contain approximately ten hours of recorded speaking and visuals into something I could realistically induce the group to spend time analyzing, I edited everything down to a few manageable chunks of one hour segments of highlights, complete with labels identifying the interviewees. This task took perhaps 20 hours, but the results were worth it.
The team reconvened to put in the great struggle of interview analysis, using a mix of the collected video segments and expansive text-based notes I captured in a spreadsheet. I tried to structure the spreadsheet so that the Controls Contractor feedback was arranged in a left to right narrative so that the group could easily transfer the insights to a journey map built on phases. The quality of this analysis performed by the group was at a high level, as everybody in the group from executives to engineers cooperated in putting in an equal amount of time in listening to audio, watching video, and discussing the findings set in text. The ability to see the reactions of Controls Contractors on video in particular added a richness to the experience which kept the group excited and focused. Sometimes, strong language put forward by the contractors offered an amusing jolt to group members, but of course served to make the customers’ recounting of frustrations in the field that much more memorable.
Following the ‘deep-dive’ analysis phase of the project, it was now time to create the final journey map of the Controls Contractors’ experience. The digital whiteboarding software Mural has provided a wonderful array of tools throughout the project, which up until now had been conducted remotely — an added challenge in keeping teammates engaged in workshops which were generally kept to a maximum of two hours at a time over a couple of months. In the future, the organization would benefit from full or half-day physical workshops off-site. This would help shorten the timeline of a project like this from months to potentially weeks.
Mural offers a great journey map template, complete with rows for customer-centric as well as employee-centric thinking that we chose to use for our final map. This type of alignment diagram is heavy with post-it notes and other elements that can be a challenge for seven people to view all at once and stay engaged (particularly when zooming in or out which some people find bothersome), so a smaller section of the group diverged to do some pre-work on the map so the larger group could then re-convene on an artifact that was somewhat more manageable to digest and offer opinions on.
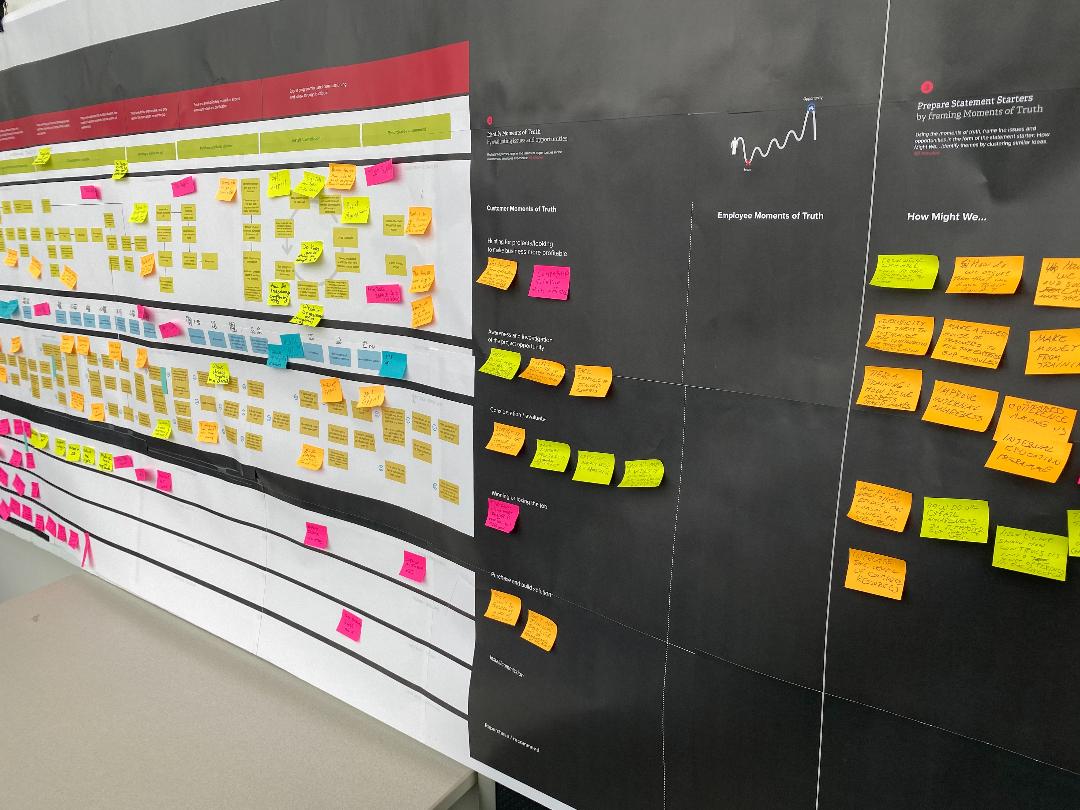
Having constructed a digital version of the journey map, the group knew it was important to construct a large physical version and socialize the Controls Contractor experience with other internal stakeholders. A workshop was planned at Armstrong head office, complete with snacks and a display screen to show snippets of customer interviews to those who had not yet been a part of the project. In the workshop, participants were encouraged to get close up and study the map for several minutes, and then discuss what parts of the experience jumped out as “moments of truth,” or things that could be corrected based on stakeholders’ experience in the field. This is where a shared empathy for the customer took shape, as well as internal alignment on how we could move forward to create projects to solve for key problem areas. Some of the prompting questions I posed to the workshop started with, “How might we…” to foster open discussion of the various strategies that could create better value for the customer.
Some of the findings reflected that some people in the organization did not have a solid grasp of how to sell the technology and the underlying concepts behind the system of value that allows Armstrong to make mechanical plants operate at a low cost. We began to realize that some effort would be required to instill added confidence and understanding of the offering before we could push out into the larger world of interfacing with Controls Contractors in the way we want to. In other words, the group found that we need to build up our own house of understanding and confidence before we can directly address the areas of friction for Controls Contractors. But how to construct these efforts so that they go beyond the day-to-day product seminars and communications that frequently do not move the ball forward?
The next step involved brainstorming, capturing a number of project ideas on a matrix that arranges ideas for projects based on their ease or difficulty to achieve and their importance or value to the customers and the organization.
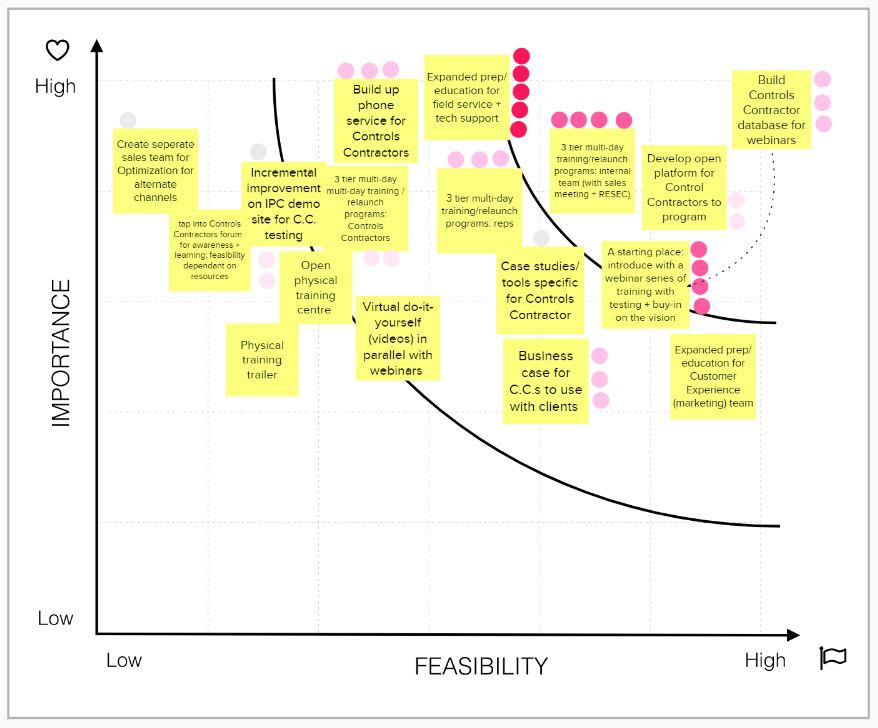 The group voted on the project ideas that appeared to offer the most value for the least effort (ideas that converged in the top right-hand corner of the matrix). The winning projects included: first, a seminar for internal teams to learn valuable knowledge about our Optimization and Automation offerings, resulting in the confidence to disseminate the technology throughout multiple territories; and second, an technical training event that is effective enough that a greater number of experts can service the technology in the field, building a service network that in turns builds up the confidence of sales, who can promise that what is sold can be serviced.
To make the projects challenging enough to be worthwhile and create momentum, we created strong value propositions with metrics worth remarking on included. These concise and powerful statements can have a lot of impact if repeated as a yardstick to measure progress throughout the execution of a project, so care was taken to make sure everybody felt positively about each project’s promise to customers and the organization.
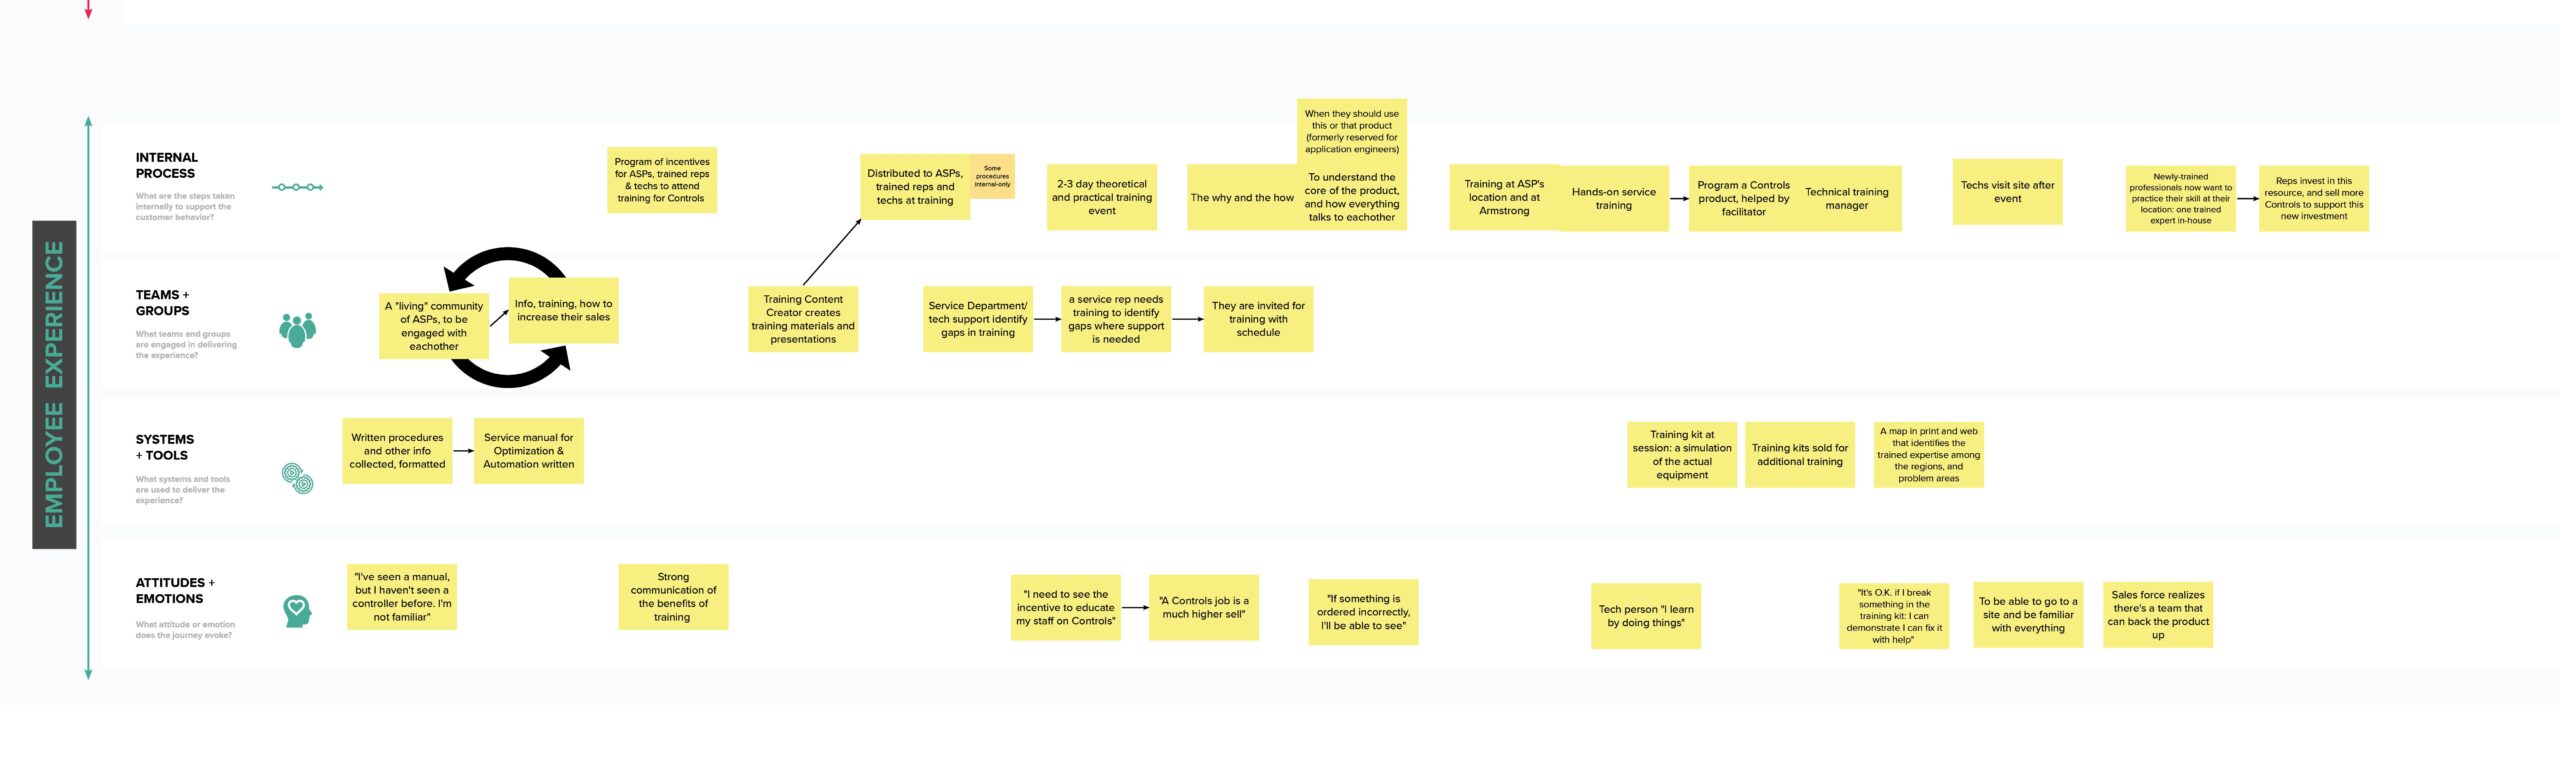
A future-state experience map was created for each project idea, which will later be incorporated into the final journey map of the Controls Contractors experience. This transforms the journey map from a ‘to-be’ recounting of the customer’s experience to a map that can be considered a hybrid of the status quo journey that is useful for diagnosis and the future state journey that the organization can work towards.
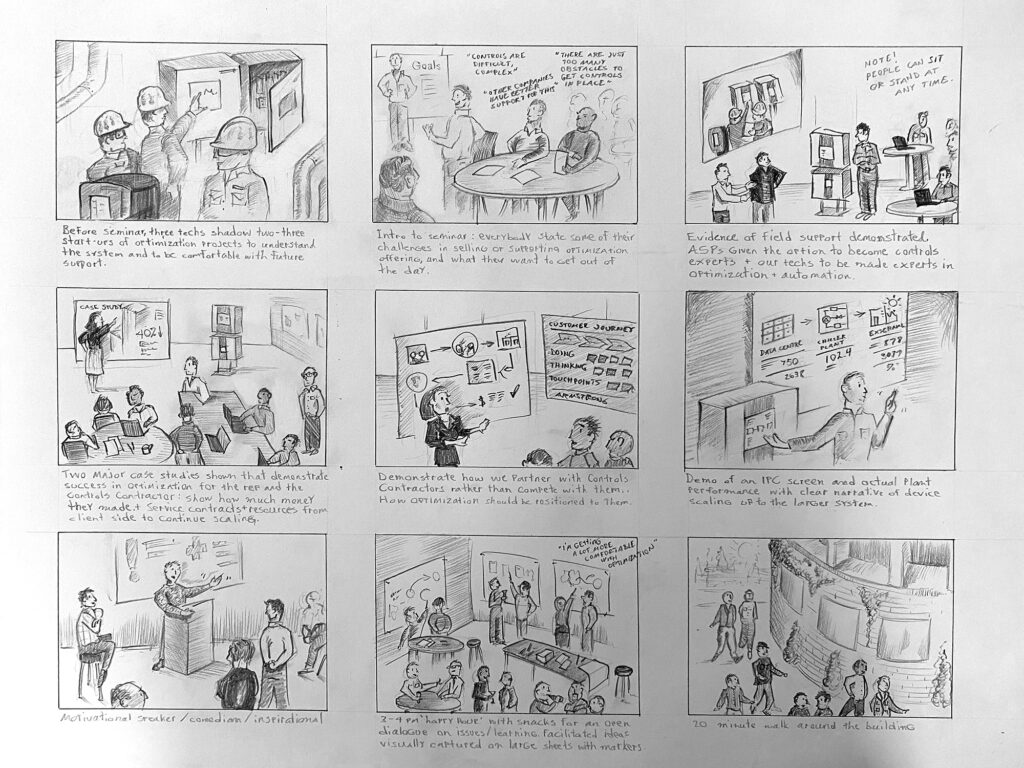
To assist in aligning people to the future-state experience, it is useful to make the journey as palpable as possible using prototype methods. Efforts like drawing out the scenario in individual narrative cells helped us receive feedback from stakeholders, giving them a clear idea of what the final outcome of a seminar or training event could look like. It’s particularly effective at bringing forward the emotions that we desire participants to have by the end of the event. For example, I illustrated in pencil how mid-way through the seminar, participants should break for a ‘happy hour’, where refreshments like beer can be served while they discuss ideas in front of large sheets of paper with markers in hand — an energetic and unusual prompt to exchange ideas in the middle of a workshop. This scenario-illustration artifact really drove home to one of the group members (a regional sales manager) that this mapping project was going to result in a real outcome, to the point that the manager was almost euphoric in imagining the practical outcomes for the kinds of activities we had been practicing throughout the project. He had never been part of a working group like this before.
From here, the to-be scenarios must be executed with the budget and assistance from others (the Who, What, and When of a 30-60-90 day plan), but this project has been a memorable and gratifying experience for those involved. We have been able to see a project build from a strategic ground up, with outcomes resting on a foundation of customer empathy, each step strengthened by strong visual frameworks that can serve as a template for journey mapping moving forward in the organization.